Playground for unknown µ, σ
Playground for unknown µ, σ
import numpy as np
import matplotlib.pyplot as plt
from matplotlib.lines import Line2D
from scipy.stats import norm
from sklearn.metrics import rand_score, adjusted_rand_score, silhouette_score

from utils import proportion
from gibbs_sampler import gibbs, multigibbs_gibbs, data_gen, make_param_dict, pred_label, score

# from matplotlib.pyplot import figure

plt.rcParams["figure.figsize"] = [10,6]
np.random.seed(10)
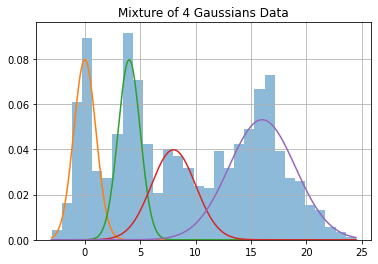
mu = [0,4,8,16]
sigmas = [1,1,2,3]
phi = [.2,.2,.2,.4]
k = 4

# Uncomment to view results for random data

# mu = np.random.uniform(low=-50, high=50, size=k)
# sigmas = np.random.uniform(low=0.1, high=10, size=k)
# phi = proportion(k=k, n=100)

n = 1000
y, class_list = data_gen(mu=mu, sigmas=sigmas, phi=phi, n=n)
x = np.linspace(min(y),max(y), 500)
# Create Plot of Data
plt.hist(y, 30, density=True, alpha=0.5);

for i in range(k):
    plt.plot(x, norm(mu[i], sigmas[i]).pdf(x) * phi[i])

plt.title(f"Mixture of {k} Gaussians Data")
plt.grid()

N_itter = 2000
burnin = 500
[mu_est, sigma_est, phi_est, z_est, trace] = gibbs(y, N_itter, burnin, k=k)
params_dict = make_param_dict(trace=trace)
x = np.linspace(min(y), max(y),500)
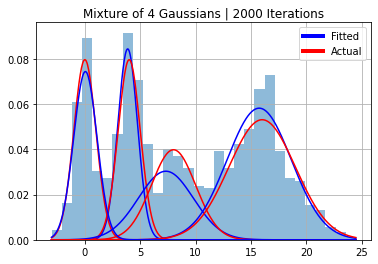
plt.hist(y, 30, density=True, alpha=0.5);
for i in range(k):
    plt.plot(x, norm(mu[i], sigmas[i]).pdf(x)*phi[i], color="red")
    plt.plot(x, norm(mu_est[i], sigma_est[i]).pdf(x)*phi_est[0][i], color="blue")
plt.title(f"Mixture of 4 Gaussians | {N_itter} Iterations")
legend_elements = [
    Line2D([0], [0], color='blue', lw=4, label='Fitted'),
    Line2D([0], [0], color='red', lw=4, label='Actual')
]
plt.legend(handles=legend_elements, loc="upper right")
plt.grid()

x = np.linspace(min(y), max(y),500)
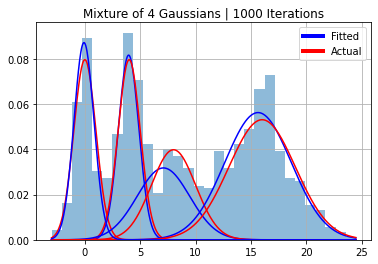
plt.hist(y, 30, density=True, alpha=0.5);
for i in range(k):
    plt.plot(x, norm(mu[i], sigmas[i]).pdf(x)*phi[i], color="red")
    plt.plot(x, norm(params_dict[f"mu{i}"], params_dict[f"sigma{i}"]).pdf(x)*phi_est[0][i], color="blue")
plt.title(f"Mixture of 4 Gaussians | {n} Iterations")
legend_elements = [
    Line2D([0], [0], color='blue', lw=4, label='Fitted'),
    Line2D([0], [0], color='red', lw=4, label='Actual')
]
plt.legend(handles=legend_elements, loc="upper right")
plt.grid()

z_est_mean = pred_label(data=y, params_dict=params_dict)
best_model = multigibbs_gibbs(y, k, N_itter, burnin)

# Gibbsampler with multiple initialisation
multi_z_est = best_model[-2]
/opt/hostedtoolcache/Python/3.8.12/x64/lib/python3.8/site-packages/sklearn/utils/validation.py:993: DataConversionWarning: A column-vector y was passed when a 1d array was expected. Please change the shape of y to (n_samples, ), for example using ravel().
  y = column_or_1d(y, warn=True)
/opt/hostedtoolcache/Python/3.8.12/x64/lib/python3.8/site-packages/sklearn/utils/validation.py:993: DataConversionWarning: A column-vector y was passed when a 1d array was expected. Please change the shape of y to (n_samples, ), for example using ravel().
  y = column_or_1d(y, warn=True)
/opt/hostedtoolcache/Python/3.8.12/x64/lib/python3.8/site-packages/sklearn/utils/validation.py:993: DataConversionWarning: A column-vector y was passed when a 1d array was expected. Please change the shape of y to (n_samples, ), for example using ravel().
  y = column_or_1d(y, warn=True)
/opt/hostedtoolcache/Python/3.8.12/x64/lib/python3.8/site-packages/sklearn/utils/validation.py:993: DataConversionWarning: A column-vector y was passed when a 1d array was expected. Please change the shape of y to (n_samples, ), for example using ravel().
  y = column_or_1d(y, warn=True)
/opt/hostedtoolcache/Python/3.8.12/x64/lib/python3.8/site-packages/sklearn/utils/validation.py:993: DataConversionWarning: A column-vector y was passed when a 1d array was expected. Please change the shape of y to (n_samples, ), for example using ravel().
  y = column_or_1d(y, warn=True)
/opt/hostedtoolcache/Python/3.8.12/x64/lib/python3.8/site-packages/sklearn/utils/validation.py:993: DataConversionWarning: A column-vector y was passed when a 1d array was expected. Please change the shape of y to (n_samples, ), for example using ravel().
  y = column_or_1d(y, warn=True)
/opt/hostedtoolcache/Python/3.8.12/x64/lib/python3.8/site-packages/sklearn/utils/validation.py:993: DataConversionWarning: A column-vector y was passed when a 1d array was expected. Please change the shape of y to (n_samples, ), for example using ravel().
  y = column_or_1d(y, warn=True)
from sklearn.cluster import KMeans
kmeans = KMeans(n_clusters=k)

kmeans.fit(y.reshape(-1,1))

kmean_cat = kmeans.labels_
print("Scores for baseline Gibbs Sampler")
_ = score(y, class_list, z_est)
print()

print("Scores for Gibbs Sampler with burnin")
_ = score(y, class_list, z_est_mean)
print()

print("Scores for Gibbs Sampler with multiple initialisation")
_ = score(y, class_list, multi_z_est)
print()

print("Scores for Sklearn KMean")
_ = score(y, class_list, kmean_cat)
print()
/opt/hostedtoolcache/Python/3.8.12/x64/lib/python3.8/site-packages/sklearn/utils/validation.py:993: DataConversionWarning: A column-vector y was passed when a 1d array was expected. Please change the shape of y to (n_samples, ), for example using ravel().
  y = column_or_1d(y, warn=True)
/opt/hostedtoolcache/Python/3.8.12/x64/lib/python3.8/site-packages/sklearn/utils/validation.py:993: DataConversionWarning: A column-vector y was passed when a 1d array was expected. Please change the shape of y to (n_samples, ), for example using ravel().
  y = column_or_1d(y, warn=True)
/opt/hostedtoolcache/Python/3.8.12/x64/lib/python3.8/site-packages/sklearn/utils/validation.py:993: DataConversionWarning: A column-vector y was passed when a 1d array was expected. Please change the shape of y to (n_samples, ), for example using ravel().
  y = column_or_1d(y, warn=True)
Scores for baseline Gibbs Sampler
Rand Index = 0.891
Adjusted Rand Index = 0.734
Silhouette Score = 0.494

Scores for Gibbs Sampler with burnin
Rand Index = 0.934
Adjusted Rand Index = 0.837
Silhouette Score = 0.602

Scores for Gibbs Sampler with multiple initialisation
Rand Index = 0.920
Adjusted Rand Index = 0.804
Silhouette Score = 0.566

Scores for Sklearn KMean
Rand Index = 0.846
Adjusted Rand Index = 0.610
Silhouette Score = 0.583
/opt/hostedtoolcache/Python/3.8.12/x64/lib/python3.8/site-packages/sklearn/utils/validation.py:993: DataConversionWarning: A column-vector y was passed when a 1d array was expected. Please change the shape of y to (n_samples, ), for example using ravel().
  y = column_or_1d(y, warn=True)
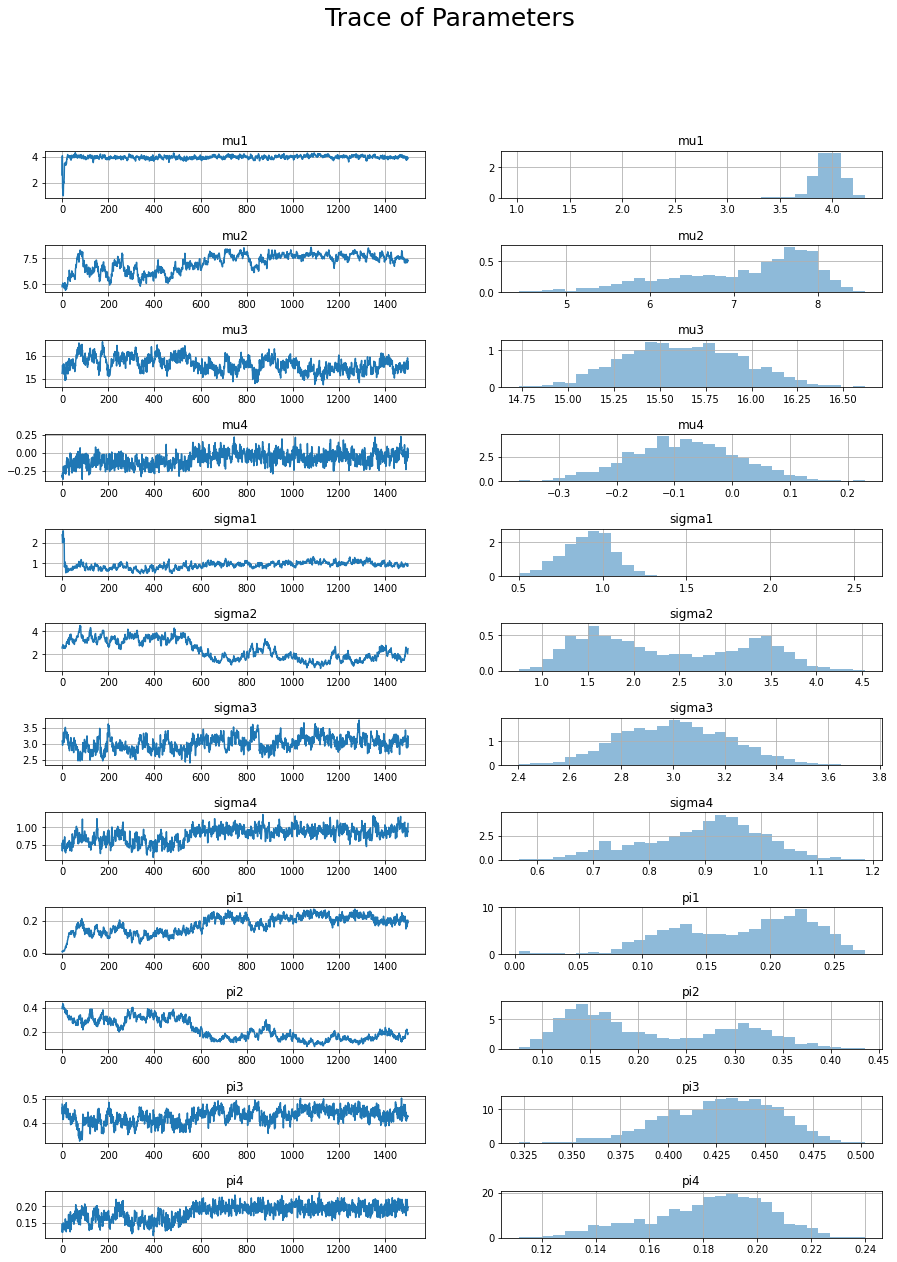
fig, axs = plt.subplots(12,2)
x = range(trace.shape[0])
params = ["mu1", "mu2", "mu3", "mu4", "sigma1", "sigma2", "sigma3", "sigma4", "pi1", "pi2", "pi3", "pi4"]
for i, v in enumerate(params):
    y = trace[:,i]
    axs[i,0].plot(x, y)
    axs[i,0].set_title(v)
    axs[i,1].hist(y, 30, density=True, alpha=0.5);
    axs[i,1].set_title(v)
    axs[i,0].grid()
    axs[i,1].grid()

fig.suptitle("Trace of Parameters", fontsize=25)
fig.set_figheight(20)
fig.set_figwidth(15)
fig.subplots_adjust(hspace=1)
