Experiments
Contents
Experiments
The various experiments done with the GMM with EM are documented here. The data was generated artificially with
Means picked from a Uniform Distribution
Variances / Covariances picked from a Uniform Distribution
Proportions selected randomly such that they add to 1
NOTE: A Covariance matrix needs to be positive semi-definite. To ensure that, we first generate a random matrix, and then multiply it by its transpose.
Since we have the ground truth, i.e. the actual clustering, we can compare K-Means with GMM using Adjusted Rand Index/Score (ARI or ARS).
(1) Univariate, Fixed Variance
1000 runs
N = 1000 points in each run
K = 3 clusters
Univariate
Variance fixed to 1. So, the M step only optimizes mean and proportions.
GMM with EM was done in 2 modes:
Best of 10 Random Initializations [Best of the 10 Log-Likelihoods obtained from each Model]
K-Means Initialization
GMM was compared with standard K-Means.
Counts
GMM with Best of 10 Random Inits performed better or equal to standard K-Means around 82% of the time.
GMM with K-Means Init performed better or equal to standard K-Means around 89.4% of the time
However, these simple counts can be misleading, as the comparison is a better or equal to. This is not a strict inequality, to account for the fact that there are runs where both GMM and K-Means give a perfect ARS = 1.
Box Plots and Histograms give a better idea.
ARS Histogram
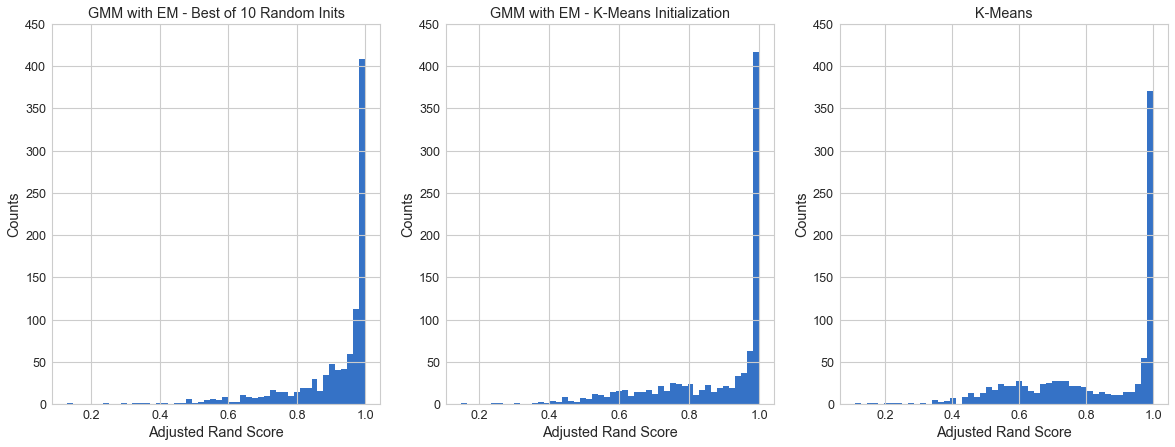
It looks like GMM is performing slightly better. To get the extent of how much, we can do box plots.
ARS Difference Box Plots
We plot the difference in ARS for various pairs.
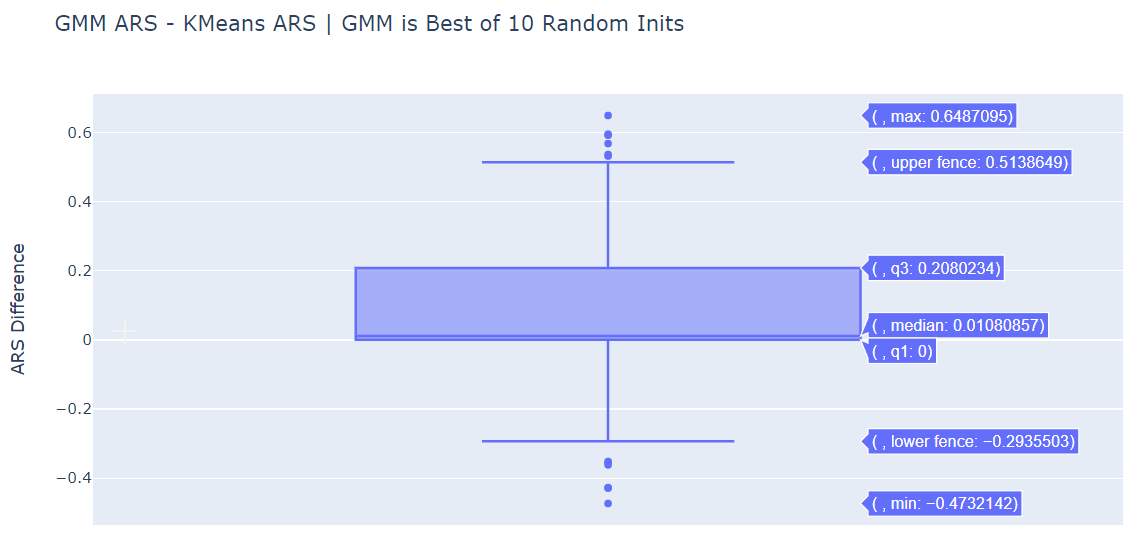
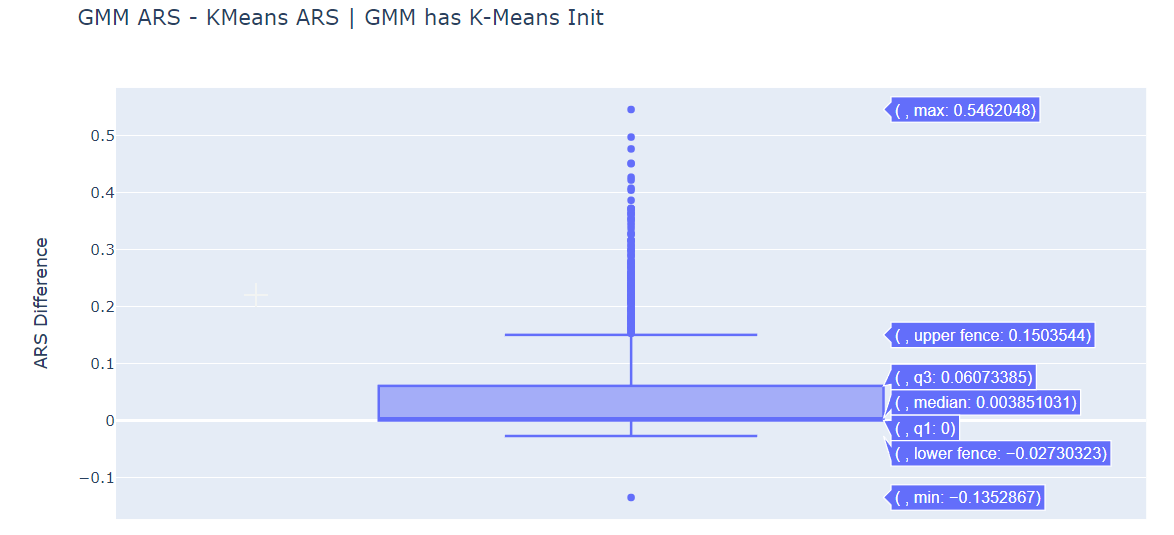
The median is positive for (GMM ARS - KMeans ARS) for both initialization methods. GMM does perform better than standard K-Means.
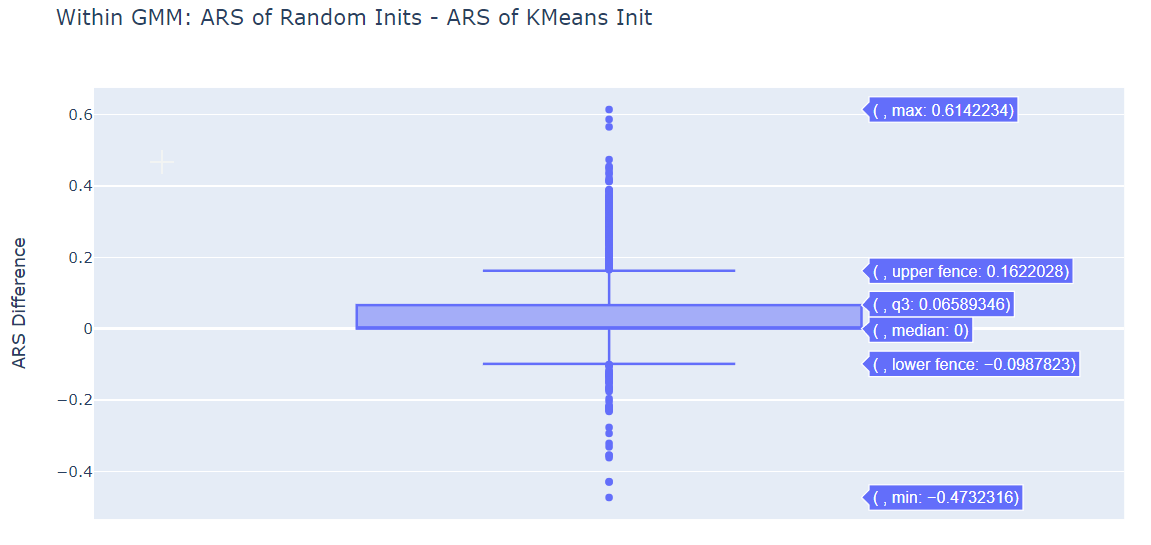
Within the GMM, both Random Initialization and K-Means Initialization seem to be more or less equivalently.
(2) 2 clusters with same mean but different variances
1000 runs
N = 1000 points in each run
K = 2 clusters with same mean but different variances
Univariate
This is a situation in which K-Means is expected to perform poorly, as the centers of both the clusters are at the same point.
GMM with EM was done in 2 modes:
Best of 10 Random Initializations [Best of the 10 Log-Likelihoods obtained from each Model]
K-Means Initialization
GMM was compared with standard K-Means.
Counts
GMM with Best of 10 Random Inits performed better or equal to standard K-Means around 69.3% of the time.
GMM with K-Means Init performed better or equal to standard K-Means around 64% of the time
As mentioned in the first experiment, take these counts with a grain of salt. Box Plots and Histograms give a better idea.
ARS Histogram
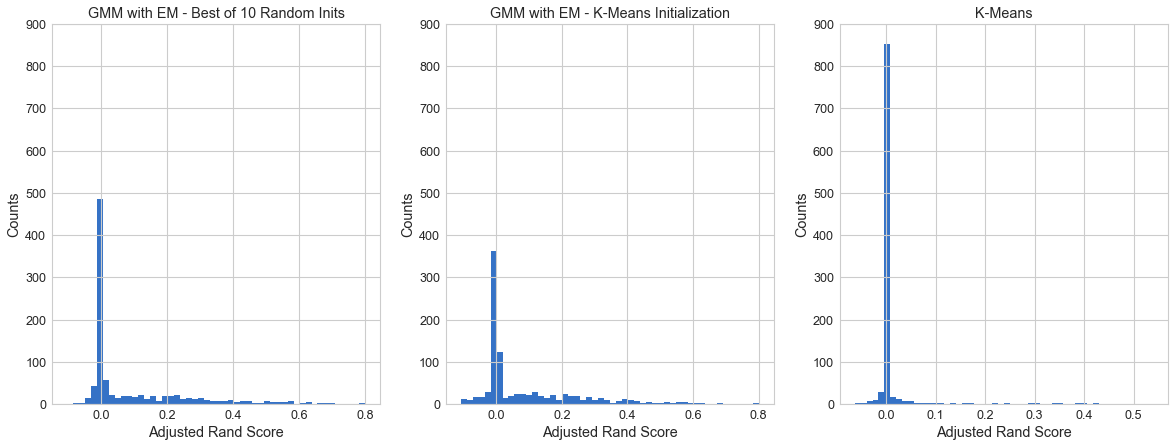
GMM is definitely performing better than the standard K-Means, in both of its initialization methods.
ARS vs Difference of Std Devs
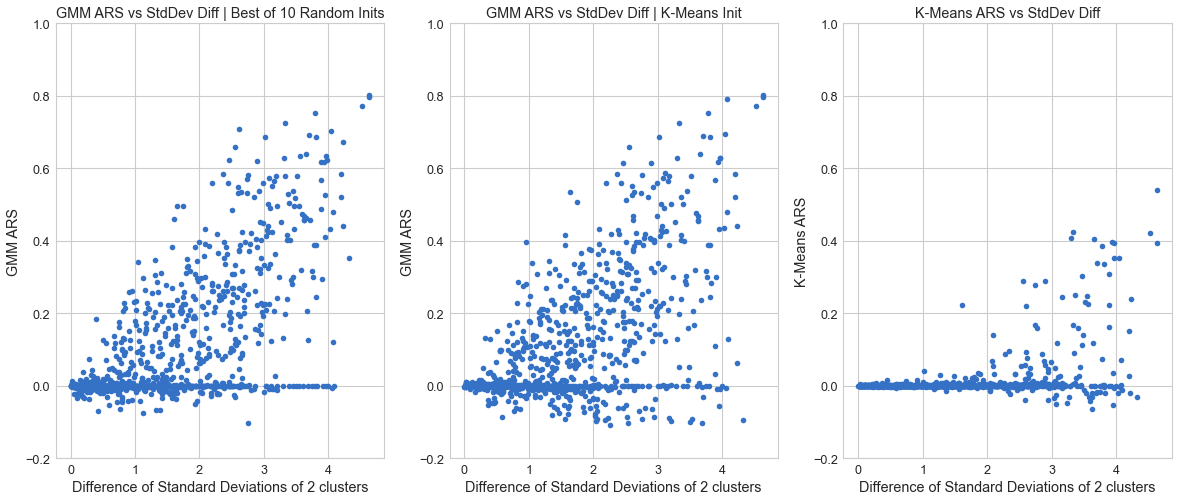
In the case where the difference of the standard deviations of the two clusters is more, GMM performs rather well, and K-Means fails as expected.
ARS Difference Box Plots
We plot the difference in ARS for various pairs.
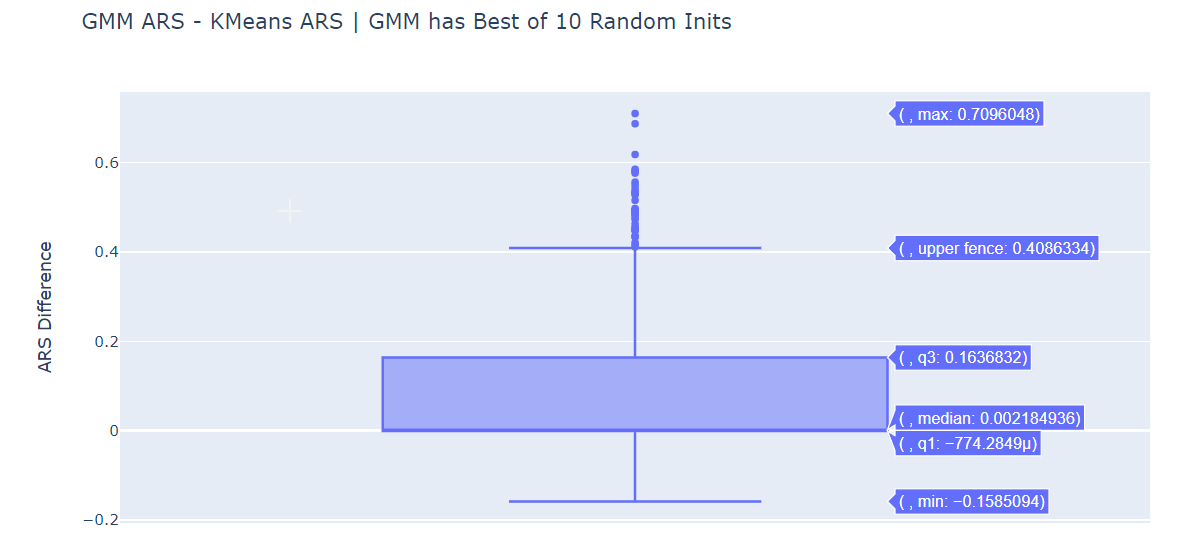
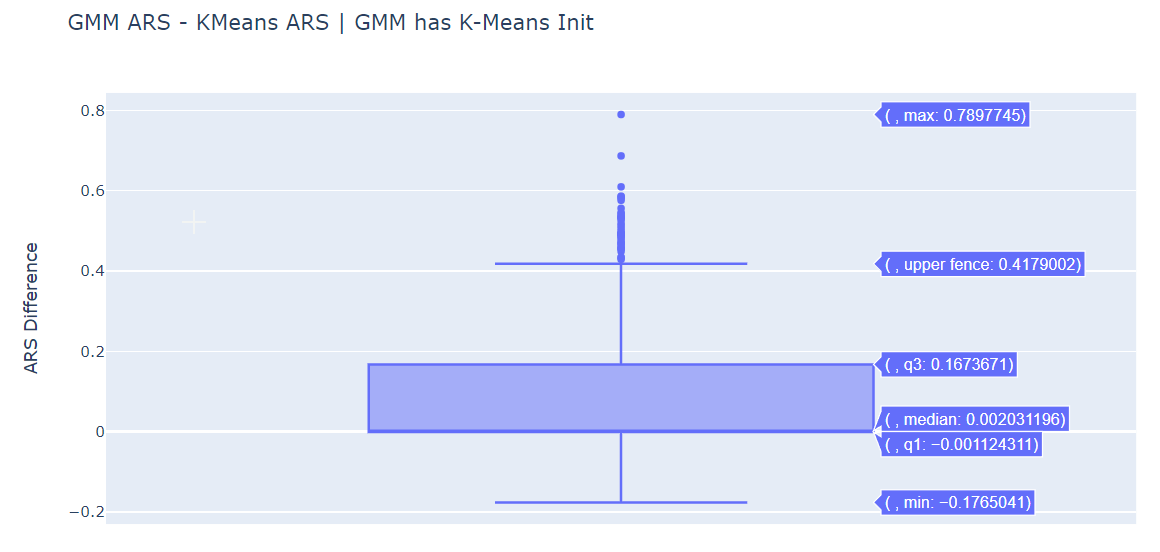
The median is positive for (GMM ARS - KMeans ARS) for both initialization methods. GMM does perform better than standard K-Means.
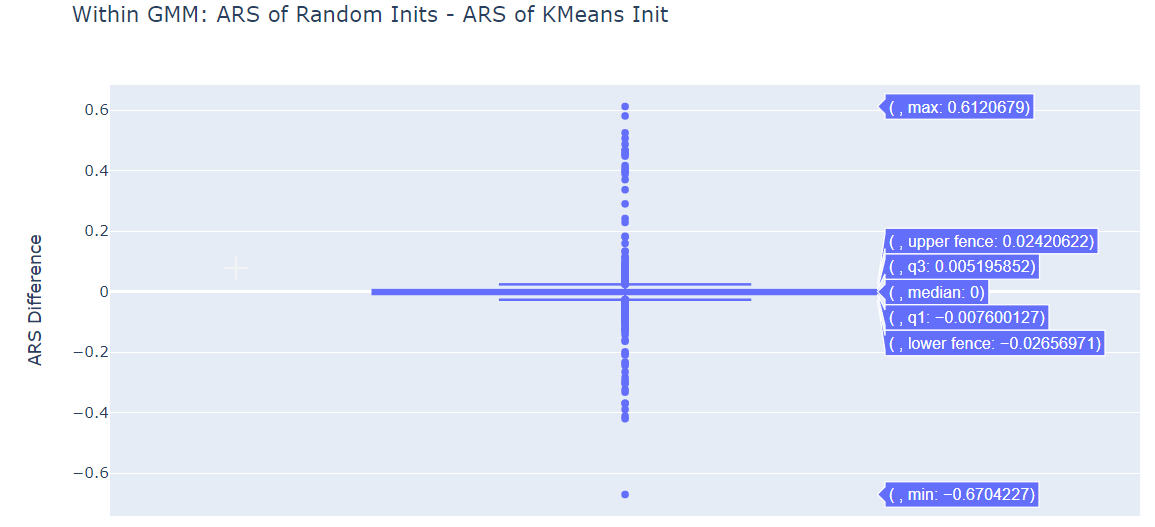
Within the GMM, both Random Initialization and K-Means Initialization seem to be more or less equivalently.
(3) Multivariate
1000 runs
N = 1000 points in each run
D = 3 dimensional observations
K = 5 clusters
GMM with EM was done in 2 modes:
Best of 10 Random Initializations [Best of the 10 Log-Likelihoods obtained from each Model]
K-Means Initialization
GMM was compared with standard K-Means. We have moved from 1 to 3 dimensions here.
Counts
GMM with Best of 10 Random Inits performed better or equal to standard K-Means around 99.8% of the time.
GMM with K-Means Init performed better or equal to standard K-Means around 99.7% of the time
Within the GMM itself, Best of 10 Random Inits performed better or equal to K-Means Init around 90.9 of the time.
The counts here present a very significant difference, compared to the last two experiments. Both the GMM modes outperform standard K-Means in almost all of the cases. The 2 or 3 runs where they didn’t, turn out to be cases where there are clusters with just 1-2 points (leading to an almost non-existent actual cluster). This likely led to Covariance Matrices for that particular Cluster turning singular, ending the run with an ARS = 0.
Even with the GMM itself, Random Initialization outperforms K-Means Initialization. K-Means Initialization means we are starting from the result of the standard K-Means, which isn’t very good in itself. Starting from many random places allows our EM algorithm to converge to better solutions.
ARS Histogram
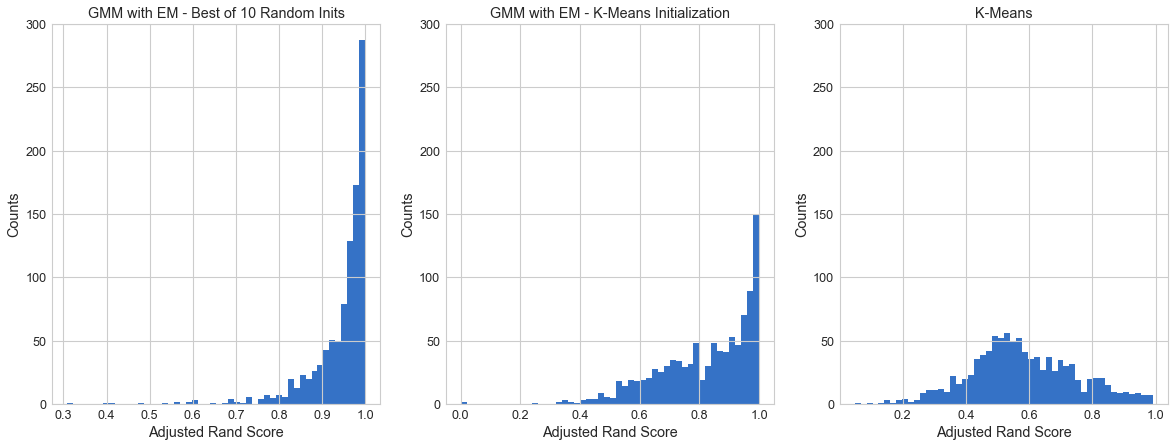
GMM is clearly performing better. There’s more instances of ARS being closer to 1 than the standard K-Means.
Even within GMM, the Best of 10 Random Inits method seems to be performing better than the K-Means Init (as is further confirmed by the ARS Difference Box Plots).
ARS Difference Box Plots
We plot the difference in ARS for various pairs.
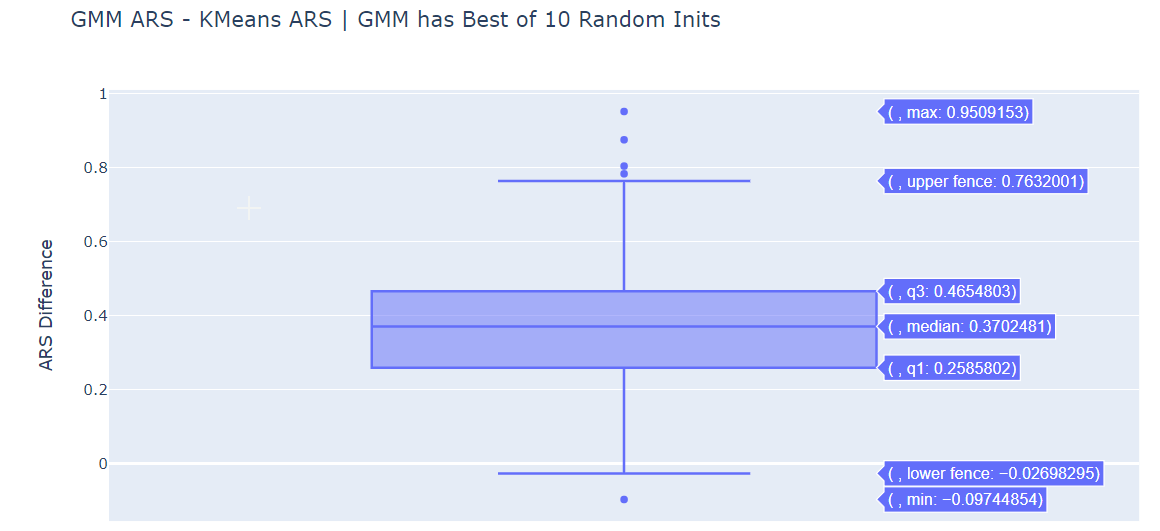
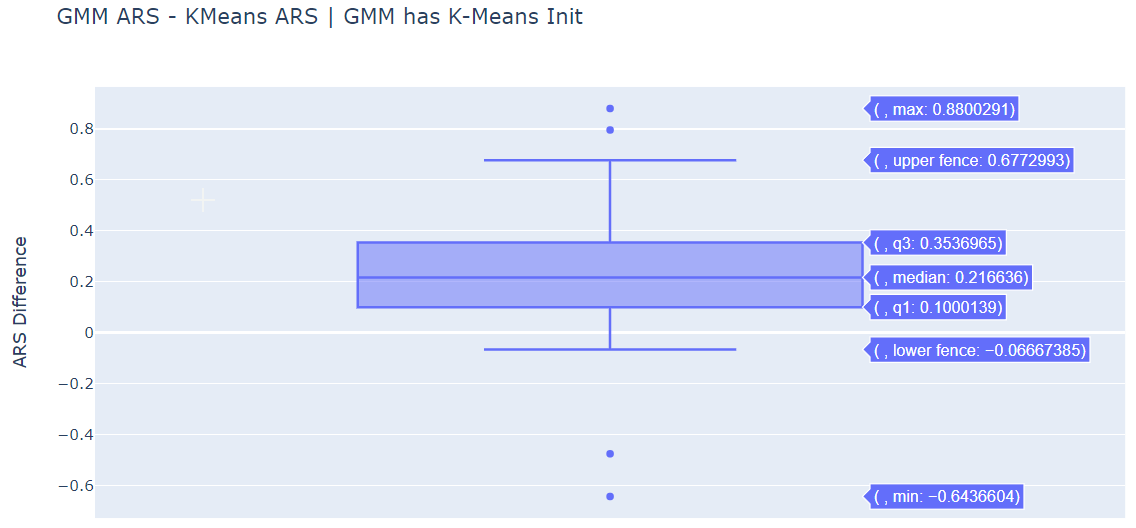
The median is significantly positive for (GMM ARS - KMeans ARS) for both initialization methods. GMM does perform better than standard K-Means.
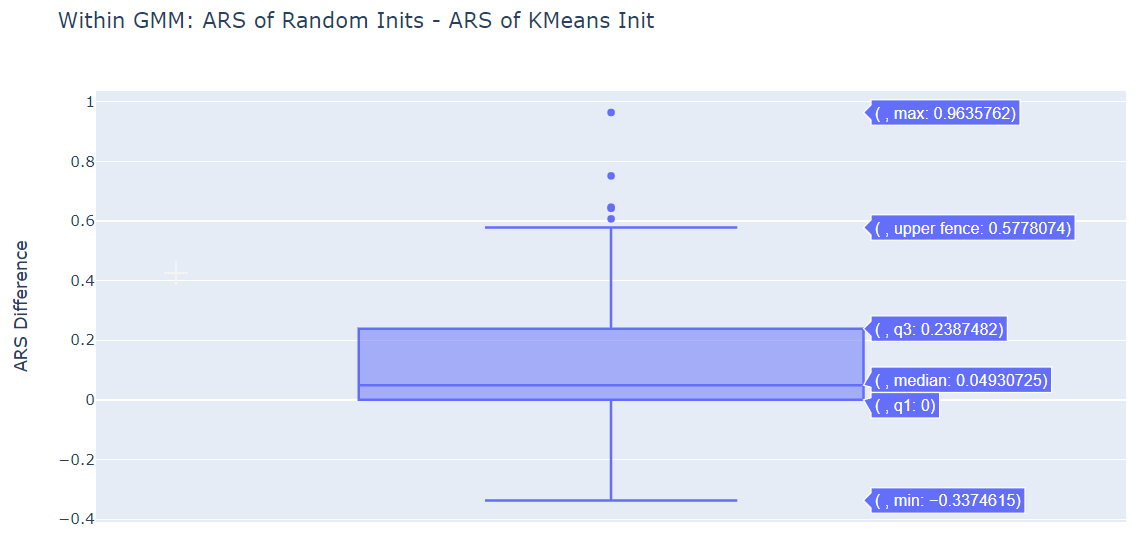
Within the GMM, the Best of 10 Random Initializations Method is performing better than the K-Means Initialization.